Humanscale
Smart Conference Chair
Gemla
GEMYT Armchair
ZINC Bar chair
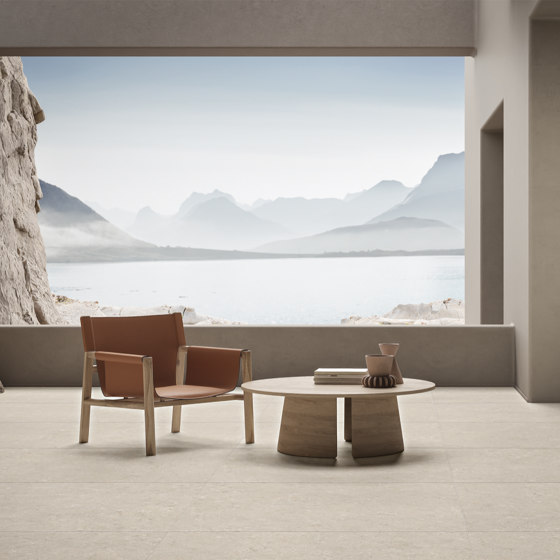
Exteta
Panarea Dormeuse Relax
Atmosphera
Apache Table
Capital
Duna Sideboard
COR Sitzmöbel
Nook Sofa
The Heritage collection blends high-performance with ...
Brand story
Ceramiche Keope
17.04.2024
Living up to its ‘Made in Italy’ standard, the Heritage collection by porcelain stoneware expert Ceramiche Keope offers increased resistance and durability while capturing the visual allure, texture and narrative of the historically charged
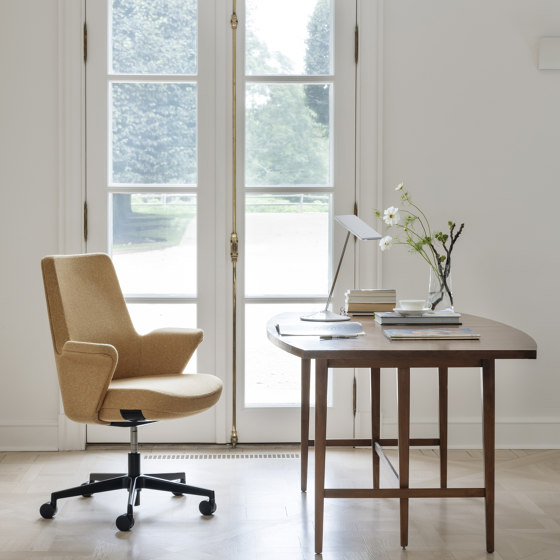
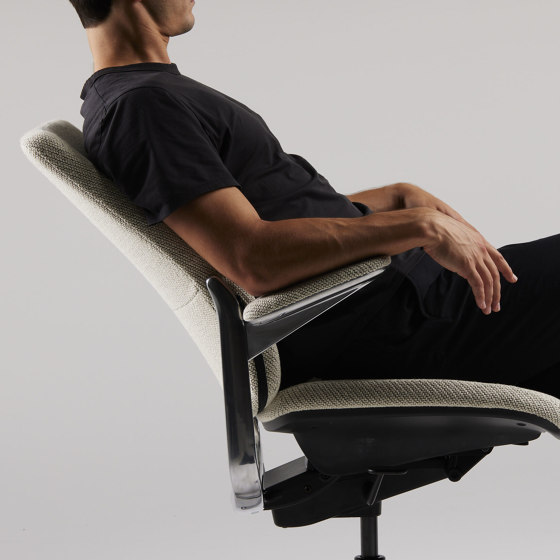
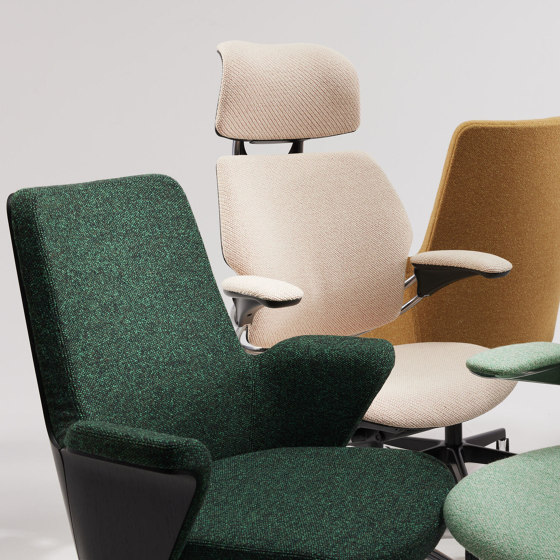
Summa by Humanscale: an executive chair on the move
16.04.2024
Carefully engineered and fully adjustable, the contemporary Summa chair once again reveals Humanscale’s mission to furnish the ever-evolving workplace – all while boasting a refined, timeless aesthetic that exudes pure luxury.
Smart Conference: Humanscale’s essential ingredient to ...
Crafted for the dynamic hybrid work landscape, Humanscale’s Smart Conference chair embodies maximum adaptability and comfort. It accommodates multiple users with ease, whether they’re working from home or in the office.
A creative coming together: Humanscale x Kvadrat
It’s a perfect fit: Humanscale, expert in office furniture, joined forces with the innovative textile brand Kvadrat. Guided by eco-conscious principles, the iconic collaboration merges ergonomic technology with captivating aesthetics.
Timeless design icons by next125
next125
11.04.2024
Elevating German craftsmanship, next125's iconic kitchen designs earn praise for their functional sophistication and technological innovation.
See all
Station Forecourt Zwolle
PosadMaxwan
Zwolle, Netherlands, 2022
Belvedere Stairs
Bertrand Taquet Architectes
Paris, France, 2022
Experience Chute Park
Daoust Lestage Lizotte Stecker
Quebec, Canada, 2021
200
/